
Your trading,
measured properly.
RECAPITAL is a trading journal and analytics platform for futures and funded traders. It pulls your fills in from your broker, grades your process out of 100 with the Edge Score, and lets you set the dollar amount below which a trade is simply break-even — so your win rate stops flattering you.
365 days of history in one sync. · Six providers. · Five asset classes.

Swipe to see the full view
Six tools. One hub.
Everything a review actually needs, and nothing that turns into another tab you stop opening.
Connect once. The history lands on its own.
Open the connect dialog, choose how far back to go, and the server authenticates, downloads your fills and rebuilds them into round-trip trades. They appear in the journal with no further step.
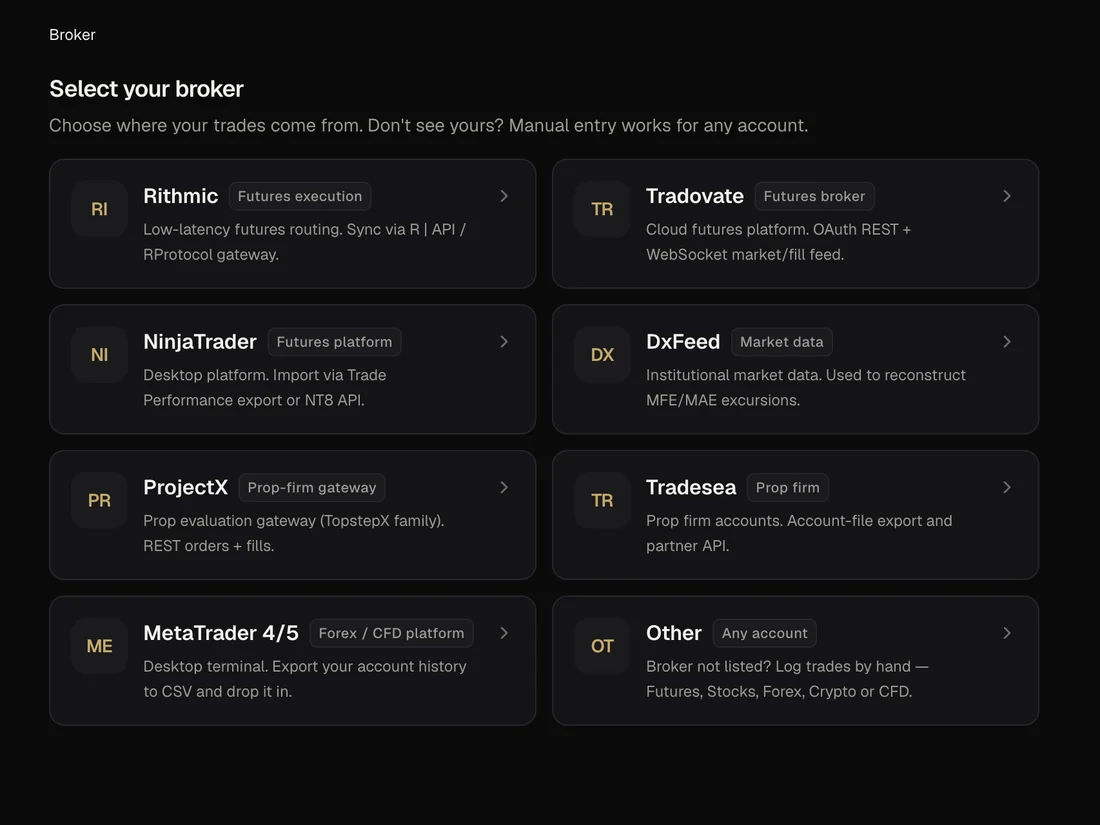
- Live sync with Tradovate, ProjectX (TopstepX family) and Tradesea
- Rithmic, NinjaTrader and MetaTrader 4/5 import by file
- Any other account works by manual entry
- Pull 30, 90, 180 or 365 days of history
- Credentials sent once over HTTPS and never kept in the browser
- Stored broker tokens are AES-256-GCM encrypted before they reach the database
Swipe to see the full view
Any other broker? Drop the file in.
Drag a statement onto the page and the columns map themselves. Matching ignores case and spacing, so ContractName, Symbol, EnteredAt, EntryPrice, PnL and Fees all find their place without you touching a dropdown.
- Drag and drop, or pick the file
- Automatic mapping for the common column names
- Asset type inferred from the symbol: futures, stocks, forex, crypto, CFD
- First five rows previewed before anything is saved
- An "X of Y rows ready" report that names the bad rows
- A sample CSV to download if you want the exact shape
Drag it where you want it.
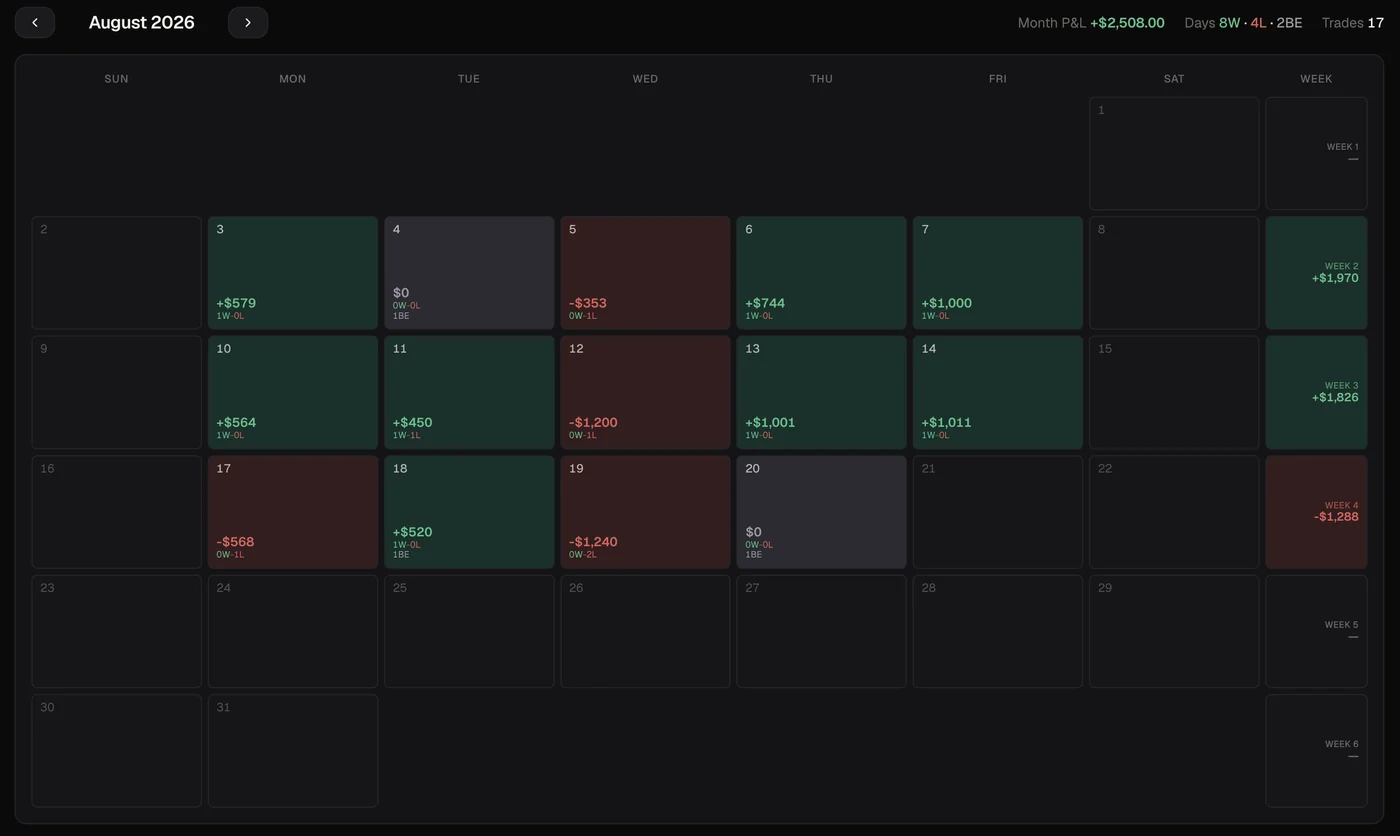
The dashboard is a widget grid you arrange yourself. The P&L calendar lives in it as a full-width widget rather than hiding on a page of its own, so the month and the metrics sit on one screen.
- Drag-and-drop widget grid you lay out yourself
- P&L calendar as a full-width widget, in the default layout
- Green, neutral grey and red days with a legend
- Existing layouts migrate on their own — nothing to rebuild
One score for the whole process.
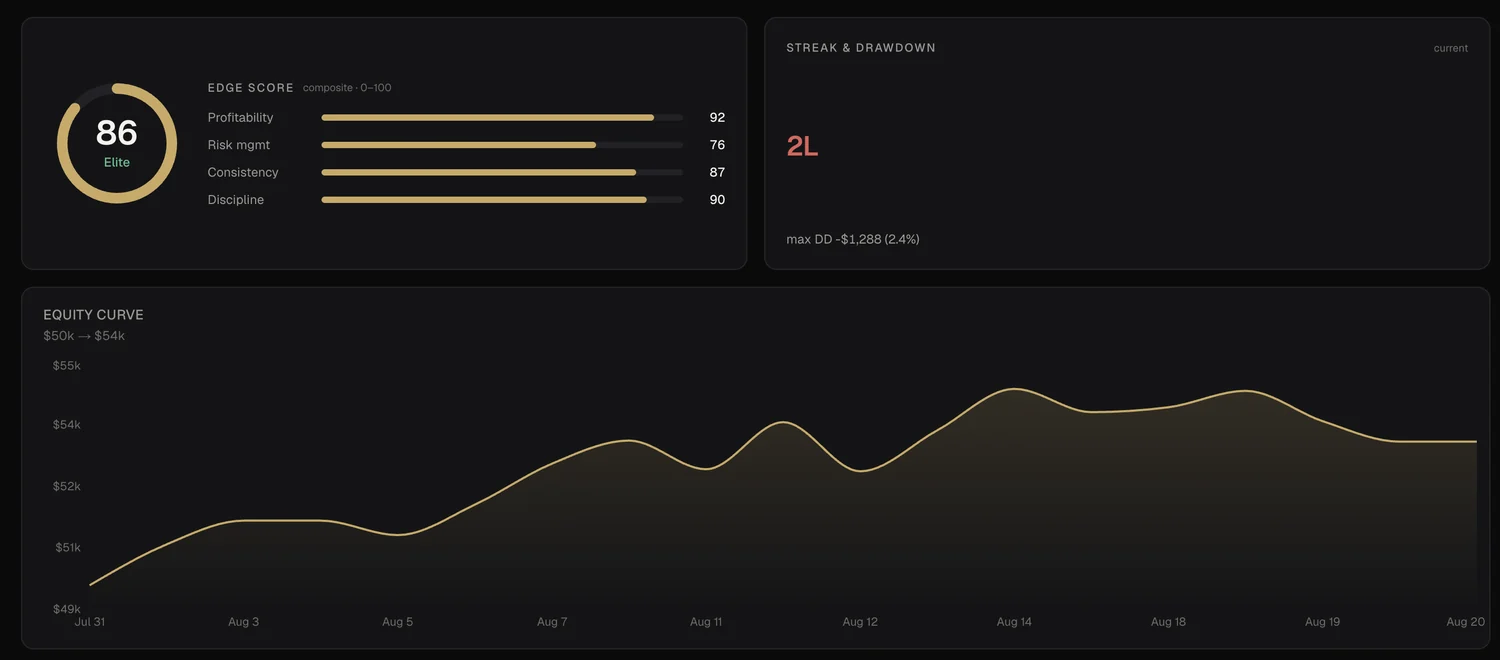
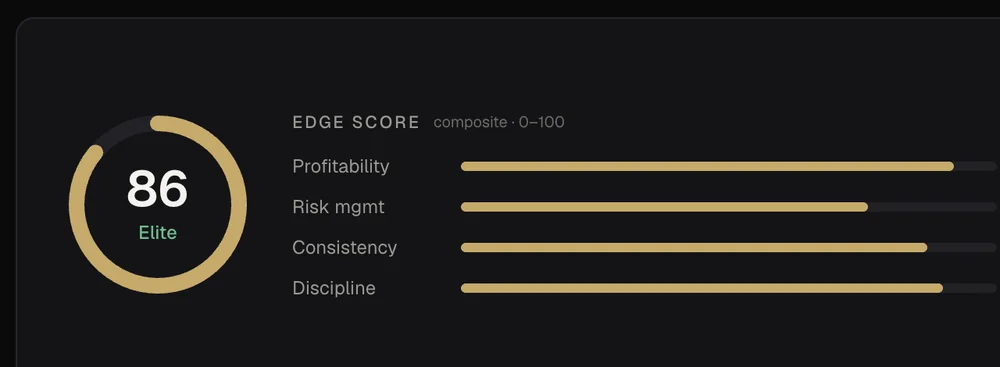
The Edge Score grades profitability, risk management, consistency and discipline out of 100 and rolls them into a single number, so you can see at a glance whether the problem is the edge or the way you are trading it.
- Edge Score out of 100, with the four sub-scores behind it
- Win rate, profit factor, expectancy and average R multiple
- Equity curve, cumulative P&L, drawdown and current streak
- Average win, average loss, largest win, largest loss
- Break-even trades held out of every ratio, kept in every dollar figure
Swipe to see the full view
Name the setup. Watch it get judged.
Write your strategies down and let the journal tell you which one actually carries the account. Playbooks are scored by the same engine as everything else, break-even rule included.
- Write out each strategy as its own playbook
- Every playbook scored on the same metrics as the journal
- The break-even threshold applies here too
- Compare what a setup earns against what it costs you
Automated coaching from your trade data.
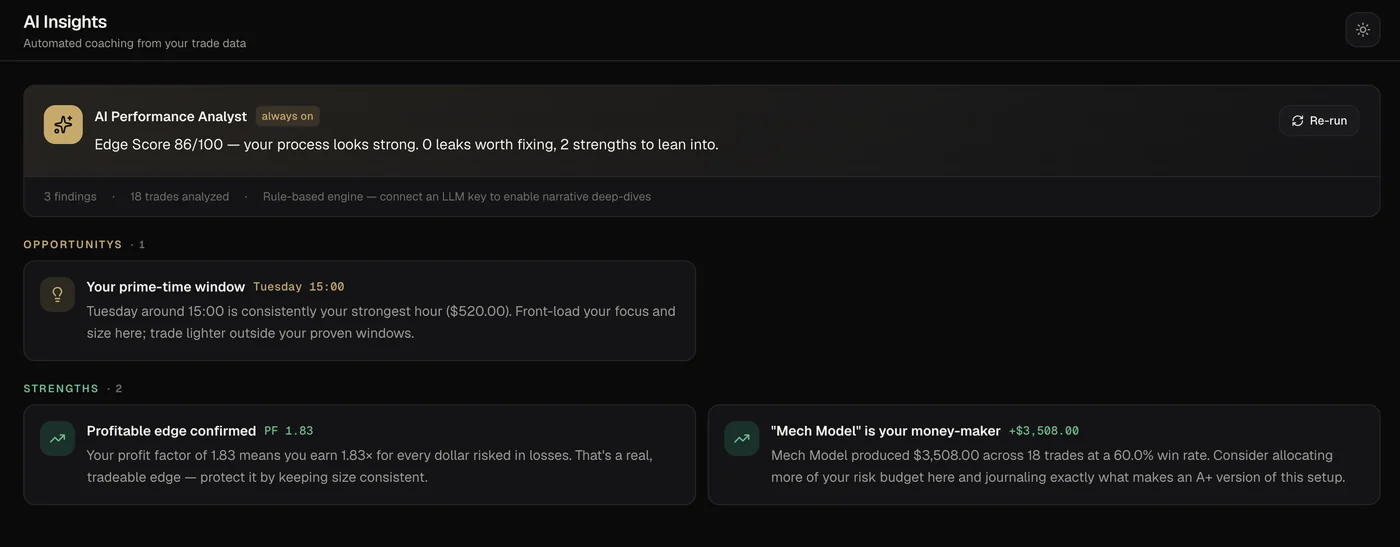
The Performance Analyst runs over every trade and sorts what it finds into leaks, opportunities and strengths — your best hour, the playbook carrying the account, the habit quietly costing you. It runs on a rule-based engine by default; add your own LLM key if you want narrative deep-dives on top.
- Findings grouped into leaks, opportunities and strengths
- Always on — re-run it whenever you like
- Rule-based by default, no credit balance to burn through
- Optional: connect an LLM key for narrative deep-dives
- Uses your break-even threshold, like every other screen
Swipe to see the full view
Set the number
that counts as nothing.
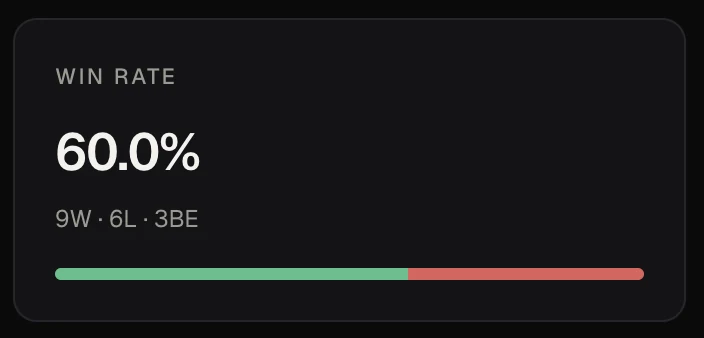
Every other journal calls a +$4 scratch a win. Pick a dollar amount — say $50 — and anything inside it is filed as break-even instead. Win rate, profit factor, expectancy, average R, largest win, largest loss and streaks all drop it from the maths. Your P&L, equity curve and drawdown keep it, because the money was real.
- Applied to net P&L, after commissions
- A break-even trade neither breaks nor extends a streak
- Daily calendar totals use the same threshold
- One shared engine, so Dashboard, Analytics, Playbooks and AI Insights all agree
- Set it to $0 and nothing changes from the way you count today
Swipe to see the full view
Built around how you actually trade.
RECAPITAL was made by a futures trader who got tired of a spreadsheet that called every scratch a win. The workflows below are the ones it was built for first.
Futures traders
Tradovate syncs live. Rithmic and NinjaTrader import by CSV until their gateways land. Fees are priced in, so an MNQ day and an ES day are finally comparable.
Tradovate · Rithmic · NinjaTraderFunded & prop traders
ProjectX covers the TopstepX family and Tradesea connects direct, so evaluation accounts journal themselves alongside everything else.
ProjectX · TradeseaScalpers
The people the break-even threshold was built for. Set it once and a page of near-flat scratches stops inflating a win rate you cannot trust.
Break-even thresholdMulti-market traders
Stocks, forex, crypto and CFDs sit in the same journal as futures. Asset type is read off the symbol on import — you do not tag anything.
5 asset classesWhat’s next.
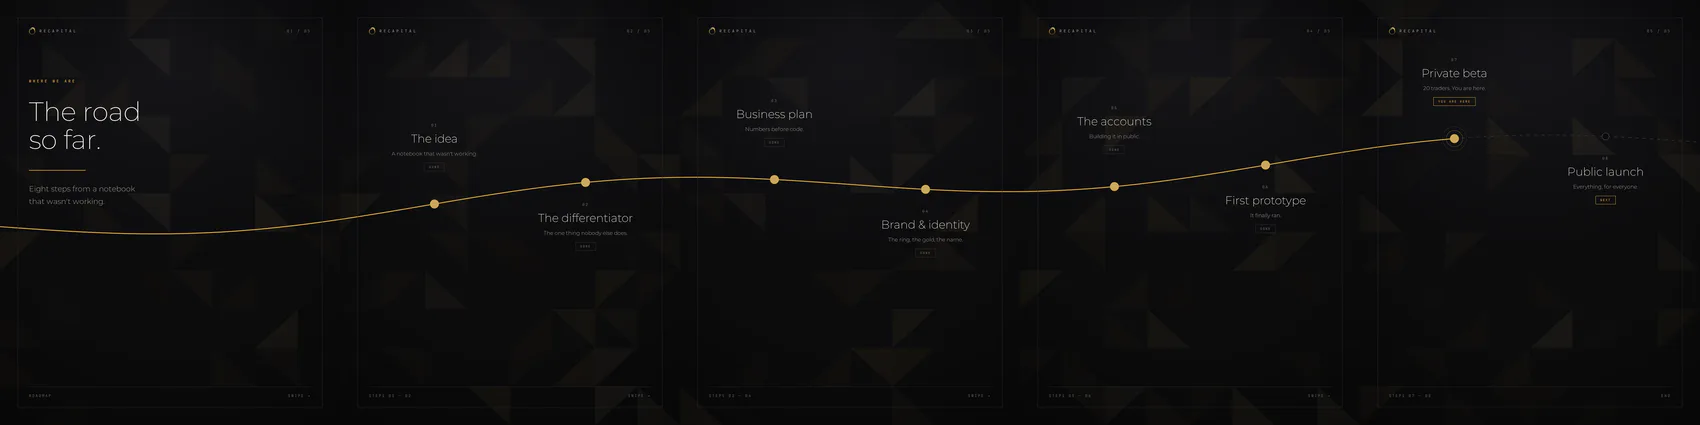
Where the product is going. Anything not on it today is not promised for today.
Three plans. Ten dollars under, every one.
Yearly billing takes a true 20% off any tier, nothing is metered, and no feature is gated behind a credit balance. Checkout is not open yet — these are the prices it will open at.
The whole journal, every metric and the break-even threshold. Imported by file.
Adds broker auto-sync on five connections, ten accounts each, and ten strategies.
Unlimited accounts, unlimited strategies and priority support when you need it.
Compare all features
$10 a month less than the closest comparable plan at TradeZella — $35, $59 and $99 after their July 2026 increase — at every single tier. Competitor prices checked 21 August 2026; check their site before you decide.
Two weeks free on every plan at launch; the trial converts to a paid subscription automatically, and the amount and the date it falls will be stated before you enter any payment details. Subscribing means accepting the Terms of service; please also read the Risk disclosure.
Before you connect anything.
Three sync live today: Tradovate, ProjectX — which covers the TopstepX family — and Tradesea. Rithmic, NinjaTrader and MetaTrader 4/5 import by file instead, and that is a limit on their side rather than ours: Rithmic speaks protobuf over a server-side gateway, NinjaTrader runs on your desktop, and MetaTrader exports account history rather than exposing an API. DxFeed sits in the list as a market-data source used to reconstruct MFE and MAE, not as a place your fills come from. Anything not listed can still be logged by hand.
It is a dollar amount you choose. Any trade whose net P&L lands inside it — say anything between −$50 and +$50 — is filed as break-even instead of a win or a loss. Win rate, profit factor, expectancy, average R, largest win, largest loss and win/loss streaks all leave those trades out. Net P&L, the equity curve and drawdown keep them, because the money moved. Set it to $0 and you get the ordinary behaviour every other journal gives you.
No. Credentials go over HTTPS once, are used for that request, and are never kept in the browser. Where a broker token has to be held to keep a connection alive, the app encrypts it with AES-256-GCM before it reaches the database — it is never written in the clear.
Yes, two ways. A live connection pulls 30, 90, 180 or 365 days of history in one pass. For anything else, drop in a CSV: the common column names map themselves, the asset type is read off the symbol, and you see the first five rows plus an "X of Y rows ready" report before a single trade is saved.
Three things: how many accounts auto-sync, how many strategies you can keep in the playbook, and whether support is priority. The journal, the analytics, the Edge Score, the dashboard and the break-even threshold are identical on all three. Yearly billing takes at least 20% off any of them — $20, $39 and $71 a month, billed annually.
A single grade out of 100 built from four sub-scores: profitability, risk management, consistency and discipline. Profitability asks whether the edge makes money; the other three ask whether you are trading it the way you said you would. It is the fastest way to tell a bad week from a bad habit — and each sub-score is shown separately so you know which one moved.
Futures, stocks, forex, crypto and CFDs, in the same journal. The asset type is inferred from the symbol at import, so you are not tagging anything by hand.
It is yours. It is never sold and never shared with a broker or a prop firm. Every table is behind row-level security, so an account can only ever read its own rows. AI Insights runs on a rule-based engine by default, so nothing leaves the platform unless you choose to connect your own LLM key.
Not yet — checkout is not open. The prices are published so you know what to expect, and that is all they are for today: nothing to pay, nothing to reserve and no list to join. When checkout opens it opens on this site, at these prices.
Two weeks on any plan, no card required, from the day checkout opens. Import your history, connect an account and run the analytics on your own trades before you decide whether the numbers are worth paying for.
Reset. Rebuild. Recapital.
Bring in your history, set the threshold that matches how you trade, and see what the numbers say once the scratches are out of them.